Dashboard Display Behavior
Dashboard display
The Dashboard displays information for rooms and patients in the selected nursing units. Dashboard columns are sorted by unit and room. The Dashboard refreshes often so that the most current data is available. Data is presented as both text and icons within the grid.
Use the Display tab on Settings to configure settings for the Dashboard page display.
Unit Census
The Dashboard displays all rooms within the selected Nursing Unit.
The following icons can be displayed next to the room number in the Room column:
- Bed Service Required icon (
 )
) - Displays Bed Service Required icon in the Room Number column when a bed associated with that room is in need of service.
- CFCM (
 )
) - Displays the Contact Free Continuous Monitoring Non-Vitals Alert icon when a non-vitals alert is sent from a bed within that room. Non-vitals alerts can include, but are not limited to, an unstable bed signal, vitals no motion, a unit malfunction, a bed sensor problem, or an expired sensor This column is required to display when "Bed HR/RR On" is selected.
The patient's name is displayed in the Patient column. The manner in which the patient's name is displayed can be configured using the Patient Name Display section on the Display tab of Configuration Settings.
Patient Information
The Dashboard displays a ![]() icon in the Incontinence column (also indicated by the
icon in the Incontinence column (also indicated by the ![]() icon) when incontinence is detected for the patient. This feature is only
available when you are using the Hillrom WatchCare®
Incontinence Management System.
icon) when incontinence is detected for the patient. This feature is only
available when you are using the Hillrom WatchCare®
Incontinence Management System.
In the Risks column, the Dashboard
displays the risk types assigned to a patient. There are three risks icons: Falls
(![]() ), Pulmonary (
), Pulmonary (![]() ), and Skin (
), and Skin (![]() ).
).
Bed Status
When a room contains multiple beds, Dashboard displays as many rows for the room as there are bed designators.
- Bed Rails -
 indicates whether a patient is detected in the bed and the state of the bed
rails. Rail positioning is only available when compatible Hillrom beds are
connected.
indicates whether a patient is detected in the bed and the state of the bed
rails. Rail positioning is only available when compatible Hillrom beds are
connected.The four rounded rectangles around the icon represent head and foot rails on the left and right sides of the bed.
- When a rail is in the UP position, the rail icon is green (
 ).
). - When a rail is in the DOWN position, the rail icon is yellow with a
downward arrow (
 ).
). - Gray rails (
 )
indicate that the state of the rails is unknown. Some beds can only
indicate that one or more head or foot rail is down, which is indicated
by a combination of a gray and yellow down rail icon.
)
indicate that the state of the rails is unknown. Some beds can only
indicate that one or more head or foot rail is down, which is indicated
by a combination of a gray and yellow down rail icon.
- When a rail is in the UP position, the rail icon is green (
- Patient Detection is available with compatible, connected Hillrom
beds.
 indicates that a patient is detected in the bed.
 indicates that the patient is out of the bed.
 indicates that patient detection is unknown.
- Bed Exit - When the bed exit alarm is set (armed), the icon is a solid green check. When the bed exit alarm is off or silenced (not armed), the icon is a yellow "X". When the bed exit alarm is going off, a red triangle alert icon is displayed.
- Bed Low - When the bed is set to the LOW position, the icon is a solid green check. When the bed is not set to the LOW position or is set to chair height, the icon is a yellow "X".
- Brake On - When the bed brake is ON, the icon is a solid green check. When the bed brake is OFF, the icon is a yellow "X".
- Head of Bed (HOB) - Displays the actual head of bed angle for connected, compatible Hill-Rom beds.
| Bed Status Alerting | |
| Bed Status OK | |
| Bed Status Warning | |
| Bed Exit Alarming |
Contact-Free Continuous Monitoring Data and Alerts
The Dashboard displays Contact-Free Continuous Monitoring active alarm statuses. Alarm statuses include, but are not limited to:
- Low/High Heart Rate
- Low/High Respiratory Rate
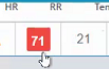
Low/high heart rates and low/high respiratory rates are indicated by a red background in the HR and RR columns of the Dashboard. For example:
- Bed HR/RR OnBed HR/RR On status indicated by icons representing the activation state of bed's CFCM monitoring:
- On - Green checkmark
- Off - Yellow X
Active alarm statuses are displayed on the Dashboard until either the alarm status is cleared or the device becomes disconnected from Smart Device Connectivity.
Patient Physiological Data
The Dashboard displays the following physiological data for each patient, including, but not limited to:
- Heart Rate (for example, from the Electronic Medical Record (EMR) application, vitals monitors, contact-free devices)
- Respiratory Rate (for example, from the EMR, vitals monitors, contact-free devices)
- Temperature (from the EMR and vitals monitors)
- Blood Pressure (from the EMR and vitals monitors)
- SpO2 (from the EMR and vitals monitors)
- Pain Score (1-10) (from the EMR and vitals monitors)
- Weight (from the EMR, vitals monitor, beds)
MEWS and SIRS
The Dashboard also displays Early Warning Risk Scores in the MEWS (Modified Early Warning Score) and SIRS (Systemic Inflammatory Response Syndrome) columns. High scores are displayed with a red background.
Recovery Wait Timer
The Dashboard displays a timer showing how long users have until the data on the Dashboard will automatically reload. Each connected Dashboard is randomly assigned a wait time between two and seven minutes. The timer is displayed in seconds and counts down (in seconds) to zero. When the wait timer reaches zero, the Dashboard will automatically refresh.