Contact Free Continuous Monitoring - Patient View Report
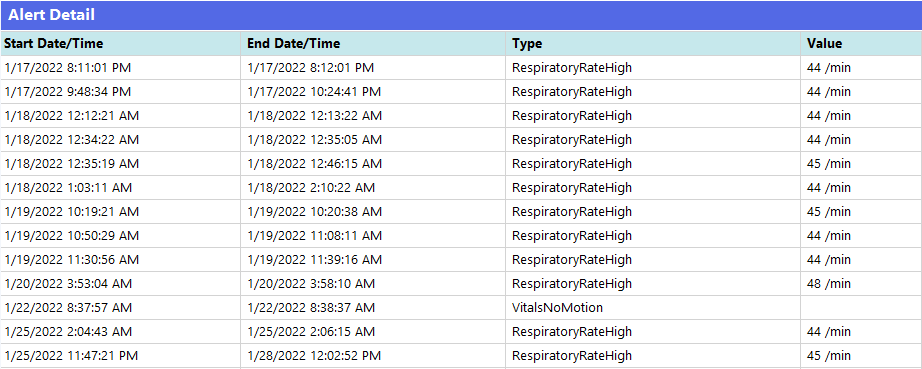
The Contact Free Continuous Monitoring - Patient View report includes metrics and alerts sent from Contact Free Continuous Monitoring devices. This report also contains an Alert Detail Table that displays the number of alerts for each alert type.
The Contact Free Continuous Monitoring - Patient View report includes metrics and alerts sent from Contact Free Continuous Monitoring devices. This report also contains an Alert Detail table that displays the number of alerts for each alert type.
Report Details
Individual alerts are displayed in a tabular format, sorted by the alert Start Date/Time and include the following details:
The following metrics for the selected time period within the selected encounter are displayed in this report:
- Daily average +/- standard deviation of patient heart rate and respiratory rate
- Hourly average +/- standard deviation of patient heart rate and respiratory rate
In addition, the Contact Free Continuous Monitoring - Patient View report includes patient demographic data, admission details, patient location history, and observed vital signs (including heart rate values and respiratory rate, with optional moving average matching configured using the Moving Avg # Periods parameter). More information about these report details can be found in the following section, Navigating the Contact Free Continuous Monitoring - Patient View Report.
Report Parameters
The report parameters can be used to narrow down the time period of the report. The parameters for the Contact Free Continuous Monitoring - Patient View report are as follows:
| Facility | Select the Facility to filter the report by. |
| Patient MRN | Select the patient MRN for whom you want to view the report. |
| Encounter | Select the encounter for which you want to view the report. |
| Report Start Date | Use to select the start date for the beginning of the report. The
date of the selected encounter is filled in by default. You can
click |
| Report End Date | Use to select the end date for the report. Click |
| Report Start Time | Select the time for the beginning of the report. The default value is the hour in which the selected encounter began (for example, 8:00 AM if the encounter started at 8:13 AM). |
| Report End Time | Select the time for the end of the report. The default value is the hour after the selected encounter ended (for example, 2:00 PM if the encounter ended at 1:45 PM). Note: If the encounter is still active, the hour
corresponding to the last time the data was extracted from the
Clinical Data Repository (CDR) for the selected Facility is used
instead. |
| Zoom Lens Date | Select the Zoom Lens Date. The default value is the Report End Date. |
| Zoom Lens Time | Select half hour increments from 12:00AM to 11:30PM; defaults to hour of Report End Time. |
| Zoom Lens Coverage | Select from 1, 2, 3, 4, 6, 8, or 12 hours. Default is 1 hour. The Zoom Lens focuses on the selected coverage period leading up to the selected Zoom Date and Time. |
| Moving Avg # Periods | Select one of the following values: 15, 30, 60, 120. |
| View | Use to select the display of the report. Select Graphical to display the report information using graphical charts. Select Tabular to display report data in a table with rows and columns. Using tabular view better enables you to export the report data into Microsoft Excel. Examples of both views are displayed below. |


